
I wrote this paper to be submitted for the 2018 MIT Sloan Sport Analytics Conference paper competition, featuring some interesting research that’s being done inside the Football Whispers Data Science team. Sadly, the paper didn’t make the final cut for the conference, but I figured I’d share it here for everyone to see as the methodology is pretty interesting and the applications have the great attribute of being both profound and accessible for everyone. Hopefully we’ll see some of these applications featuring in the Football Whispers site and editorial content soon.
If you can’t be bothered to read the whole paper (which can get unnecessarily technical to be fair), here’s a re-write of its main content written with a less ‘academic’ narrative.
We all know that football is a complex subject to study under the lens of data analysis and statistics. Football is a dynamic and fluid invasion sport, with highly interdependent events occurring simultaneously and continuously. As a consequence, a lot of applied research into football data falls into the trap of being non-descriptive; essentially a “black box” that seems to declare rigid answers that rarely trickle down in descriptive, applicable or accessible ways to short-term stakeholders like clubs and coaches interested in winning the next game or planning their tactical system. Perhaps this flaw goes a long way in explaining why football analytics meets such resistance from coaches, scouts and others when in reality, both lines of work should embrace each other as treasured allies working together towards the same goal.
What football analytics (or at least a reasonable portion of it) should really aim for is to balance out both objectives: it should leverage the insight to be extracted from huge amounts of complex data that the brains of coaches and scouts cannot process, but should also make sure its results are descriptive and accessible for the more organic domains of knowledge that coaches have about the game. If analytics knowledge and coaching knowledge are incompatible, it is ultimately football that is missing out.
The methodology that we used for this paper is inspired from an area of research that faces very similar circumstances: Natural Language Processing (NLP). More specifically, Topic Extraction, which is concerned with automatically sorting text documents into the different semantic topics that constitute it. In the information age, automatic methods for classifying large amounts of documents semantically are incredibly practical. Burgeoning fields such as digital marketing and sentiment analysis of social media content rely heavily on the scalability of text mining: most humans can classify tweets about a brand into different ‘sentiment categories’; but, just as in the case of our treasured coaches, the manpower needed to do this across the vast quantities of data available is completely unfeasible. Likewise, if the results from Topic Extraction don’t line up with natural categories and sentiments that human readers would sort documents into, it makes them extremely hard to leverage for say a marketing agency.
Our research takes a page out of the Topic Extraction handbook and repurposes one of its foremost models called Latent Dirichlet Allocation (LDA) to be applied to football data. I won’t get into the exact details of our conceptualisation of styles in football within the framework of topic extraction, but the basic idea is that just as different words in documents determine the document’s topic, so too should different features in a football match determine the style of the teams/players involved. When an LDA model is fit to a set of documents, it will produce a set of ‘topics’ characterised by key words. The image shows the key words associated to each topic of an LDA model fit to a large set of news articles.
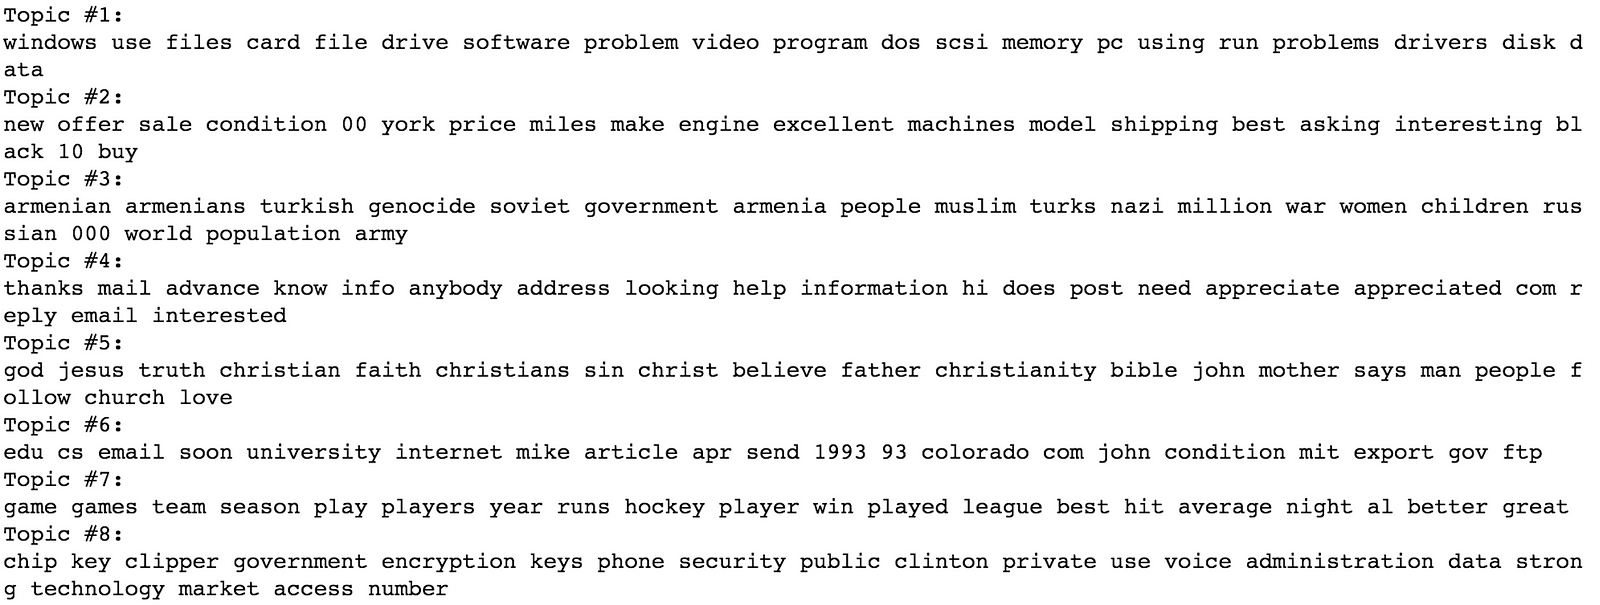
By looking at the key words we can naturally imagine what subject each ‘topic’ refers to. In the example, topic 1 corresponds to technology articles, topic 2 probably identifies sales ads while topic 3 includes news articles of Eastern Europe, etc. LDA’s major plaudits stem from the fact that it is unsupervised: the algorithm picks up on these reasonable and natural semantic topics that differentiate the different news articles with zero human intervention.
After a model is fit, it can be used to process new documents and will classify them as a mixture of the bespoke topics, which basically means it will say things like “this document is 30% technology, 40% sale ad, etc”. It does this by analysing the frequency of different key words appearing in the document. The thinking process behind our methodology should have become clear by now: an LDA model will analyse the frequency of features of a team in a match, such as ‘long ball into opposition half’, ‘touches’, ‘interception’, etc; and classify it into a mixture of the different styles it learned.
Our model was trained on data from Europe’s big 5 leagues for the 2016-17 and 2017-18 seasons. These are roughly the topics it learned:

With a trained model, we can think of wide range of applications by using the model to classify matches from teams in different contexts. ‘Radar charts’ are a convenient way to superimpose the percentages corresponding to different styles.
REMARK: Radar charts are a common feature in football data analytics, but in a very different use case which might make our visualisations ‘miss the point’ if the main difference isn’t explained: in traditional uses of radar charts, a team/player’s chart can be indefinitely large in all axes of the chart. If an axis is ‘xG’, there’s no real limit on how large this value can be for a team. In our use of radar charts, the ‘percentage’ on each category isn’t related to total volumes but rather relative frequencies and as such they must add up to 100% between all of them, and so a team’s radar simply cannot be very large in all the axes. It is important that the reader keeps all this in mind while interpreting the radar charts below.
A snapshot impression of a team’s playing style can be obtained by plotting the average percentage in which their matches fall into each category.

Another interesting use is comparing the style of match a team plays with or without a player, which can have very real and straightforward impact on team selection and squad management. Paul Pogba, Manchester United’s record signing, is a prime example of a player whose absence is heavily felt in terms of the style.

In direct selection dilemmas, like Danny Rose versus Ben Davies at left-back for Spurs, this methodology can provide context for Pochettino to make his choice:

Notice how the profiles are practically mirrored from each other: when Rose is playing Davies is not and vice versa.
Similarly, we can compare the styles of teams before and after a managerial change to see how the manager has impacted the type of football they play. Allardyce taking over at Everton provides a prime example of a team whose style clearly changed with a managerial shake up.

Marcelino taking over Valencia provides another compelling example considering Valencia’s remarkable upturn in performance this season:

.
LDA Model for Players
This exact same methodology can be applied to the frequency of features a player performs as opposed to the whole team. An LDA model fitted to data from midfielders across Europes big 5 leagues found the following set of topics:


This result gives us chance to further the point of ‘relative proportions’ rather than ‘absolute volumes’. It would be hard to argue that Mesut Ozil isn’t a proficient passer, or that somehow Fellaini is a more proficient passer than he is! When interpreting these radars the reader has to remember that this is about: what style categories do the player’s features seem to stem the most from in proportionate terms? Ozil can have high volumes of the features related to ‘proficient passing’, and most probably much more than Fellaini. However, proportionately, his features are more aligned with ‘Chance Creation’ than those of ‘Proficient Passing’.
A similar model for defenders is presented below.


As an example, this methodology nicely highlights the impact that playing under Guardiola’s all conquering Manchester City side this season has had on ex-Spurs full-back Kyle Walker.

Finally, this methodology also provides a very clean and clear framework for ‘similar player’ suggestions. When combined with performance ratings for players that we have also developed for players here at Football Whispers, we can imagine a simple and elegant ‘similarity’ concept along these two key axes: playing style and performance level.
This particular application faces stern competition from many previous methods, like clustering based methods or even what I presented at the Opta Pro Forum in 2017. However, this methodology has the upper hand in the descriptiveness of its suggestion: everyone who uses it can immediately digest exactly what it is saying, as opposed to other ‘similarity’ classifiers which can at times seem “black box-y”.
Lionel Messi Similarity Recommender

The appeal of this approach is how digestible it is. Lewandowski performs to similar standards than Messi but is a different style of player. Dybala and Alexis are similar types of players but don’t perform to the same standards. Neymar and Insigne are both similar in style and in quality.
Jorginho Similarity Recommender

This last application is kind of too simplistic to make any grandiose claims around it, but it has passed every single ‘eye-test’ I have submitted it to so far. Might be worth investigating it more thoroughly as this content evolves on the site. For now though, I’ll leave you with a link to our little taster video for this type of content.
No comments:
Post a Comment